🚀 New batches open: Advanced Excel • Power BI • SQL • AI for Analytics — Book a free demo
Data Analytics • Automation • AI

Turn data skills into career power.

Master Excel, VBA, SQL, Power BI, Python and AI with real business datasets, projects and mentor-led learning designed for the modern workplace.

7+Career tracks
100%Hands-on
1:1Mentor support
LiveProjects
What you can learn

One academy. A complete analytics toolkit.

Build the stack used in MIS, reporting, analytics and automation teams.

📊
Beginner → Advanced

Advanced Excel

Master formulas, dashboards, Power Query and advanced reporting.

  • XLOOKUP & INDEX-MATCH
  • PivotTables & dashboards
  • Power Query
  • Advanced reporting
⏱ 6 weeks▶ Free lesson

⚙️
Intermediate

VBA Automation

Turn repetitive Excel and MIS work into one-click workflows.

  • Macros & loops
  • UserForms
  • Report automation
  • Error handling
⏱ 5 weeks💻 Projects
🗄️
Core Skill

SQL Server

Query and transform relational business data with confidence.

  • Joins & aggregations
  • CTEs & subqueries
  • Stored procedures
  • Window functions
⏱ 6 weeks💻 Projects
📈
In Demand

Power BI

Build interactive management dashboards from raw data.

  • Power Query
  • Data modeling
  • DAX
  • Publishing & sharing
⏱ 6 weeks💻 Projects
🐍
Modern Analytics

Python for Data

Clean, analyze and visualize datasets using Python.

  • Python foundations
  • Pandas & NumPy
  • Data transformation
  • Visualization
⏱ 7 weeks💻 Projects
📋
Job Oriented

MIS Reporting

Design accurate, automated daily, weekly and monthly MIS.

  • KPI design
  • MIS automation
  • Management dashboards
  • Reporting workflows
⏱ 5 weeks💻 Projects
🤖
Future Ready

AI for Analytics

Use AI to accelerate formulas, SQL, insights and reporting.

  • AI-assisted Excel
  • SQL prompting
  • Insight generation
  • Responsible AI
⏱ 4 weeks💻 Projects
See all course details →
7+Specialized tracks
100%Practical learning
1:1Doubt support
LivePortfolio projects
Inside the classroom

What you will actually build.

Every track ends in work you can show — dashboards, pipelines and KPI reporting.
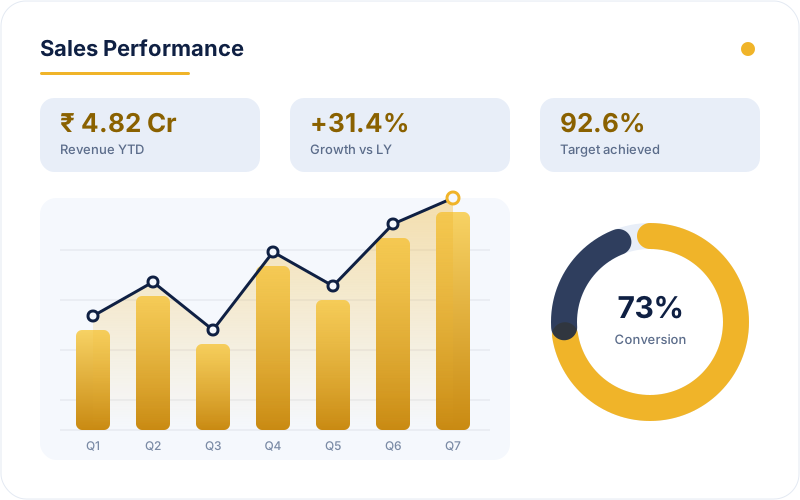
Sales performance dashboard with bar chart, trend line and conversion donut
📊 Management dashboardsBar, trend and conversion views built in Excel and Power BI.
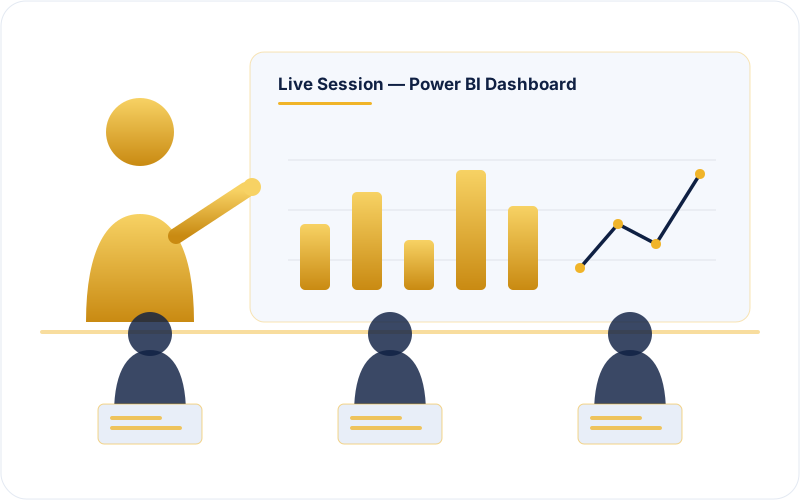
Mentor teaching a live Power BI dashboard session to learners
🧑‍🏫 Mentor-led live sessionsLearn the workflow on screen, then build it yourself.
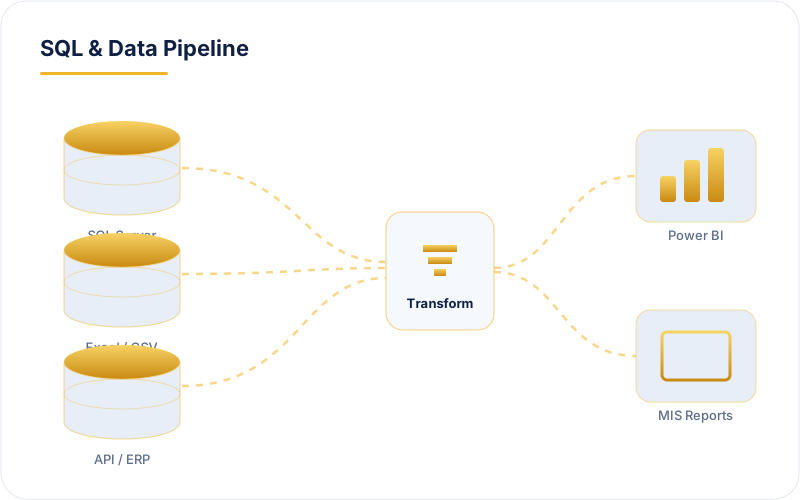
SQL Server, Excel and API sources feeding a transform layer into Power BI and MIS reports
🗄️ Database connectionsConnect SQL, Excel and APIs, then transform into clean reporting.
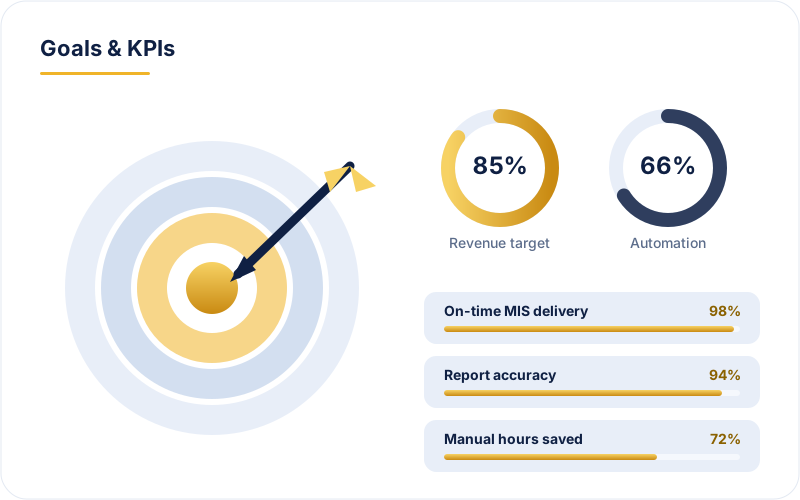
Goal target with KPI gauges for revenue, automation and accuracy
🎯 Goals & KPI trackingDefine targets and measure them the way management does.
The DAI ACADEMY Method

Learn. Grow. Succeed.

Go beyond watching videos. Build, solve and automate.

01

Learn

Build strong foundations with structured lessons and guided exercises.

02

Grow

Work with realistic datasets and solve business-style problems.

03

Succeed

Build dashboards, automation and portfolio-ready projects.

Built for outcomes

Skills that show up in your work.

🎯 Job Ready

Interview-focused projects and business scenarios.

⚡ Automation

Reduce repetitive reporting and manual effort.

📁 Portfolio

Dashboards, reports and automation projects.

🧑‍🏫 Mentorship

Personal guidance and doubt-clearing.

Student portal

Your course, your material, your progress — in one place.

Create a free account and sign in any time to pick up where you left off.

🎬 Class recordings

Every session your trainer uploads, ready to watch again before an interview.

📂 Course material

PPTs, PDFs, interview questions and live project files for your batch.

📈 Progress & placement

See how far your batch has come, and apply to vacancies shared with us.

Create my free account → 🔒 I already have an account

Free to create. Your course material appears as soon as the academy adds you to a batch.

Ready to level up your data career?

Book a free demo. See the curriculum and choose the right path before you enroll.

Book My Free Demo →