
Home / Learning Path
Your roadmap from learner to analyst.
A structured journey from fundamentals to business-ready output.
01
Learn
Master Excel, SQL, reporting logic and data-cleaning foundations.
02
Grow
Use realistic datasets to answer business questions and communicate insights.
03
Succeed
Automate recurring work and build portfolio-ready projects.
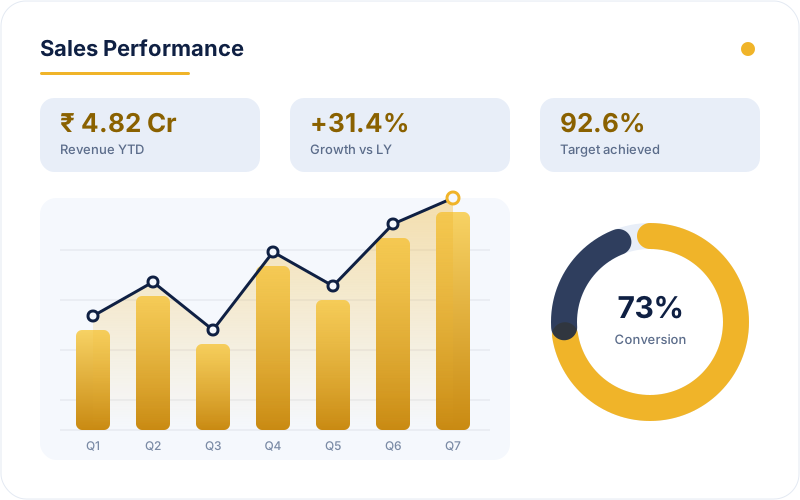
The finished output
You leave with a dashboard, not just notes.
By the end of a track you will have built a working report from a real dataset — the same kind of output a reporting or analytics team ships every week.
- KPI tiles tied to a business target
- Trend and comparison charts that answer a question
- A refresh process that runs on a schedule
- A short walkthrough you can present in an interview
What each stage looks like
Structured, not scattered.
📚 Guided lessons
Concepts taught in the order you will actually use them at work.
🧪 Practice sets
Exercises after every module so the skill sticks.
📊 Live projects
End-to-end builds you can show in an interview.
Start at the right stage for you.
Tell us your current skill level and we will place you on the right track.
Book My Free Demo →